MoST
May 2025
Preface
This is a high-level synopsis of my Honors Thesis titled MoST: Model Selection & Temporal Shifting on Reducing Carbon Emissions Across Datacenter Workloads written during my time at the University of Minnesota . The document presented here will primarily focus on introducing sustainable computing and relevant research alongside the quantitative results of my work under the guidance of Abhishek Chandra .
Introduction
Cloud datacenter electricity consumption in the United States is projected to grow by 13% - 27% between 2023 and 2028, driven largely by cryptocurrency and, more recently, generative-AI inference [1]. Roughly 60% of that electricity is still generated from fossil fuels, so this growth carries a substantial carbon footprint [2].
Most prior work in this space reduces emissions by moving when or where a job runs to line up with periods of cleaner energy. MoST adds a second lever: model selection. Because an AI task can often be served by several models of differing size and accuracy, the scheduler can pick the smallest model that still satisfies the accuracy requirement and then defer that job into a low-carbon window. The result is a carbon- and model-aware policy that meets its service-level objectives (SLOs) while cutting average emissions by 5.4% - 23.2% compared with conventional static and model-selection-only policies.
The Simulator
Traditional datacenter simulators such as CloudSim Plus model capacity contention and resource provisioning [3]; the policies studied here instead operate at the application layer and assume the datacenter has sufficient capacity. This motivated a purpose-built simulator, shown in Figure 4.1.
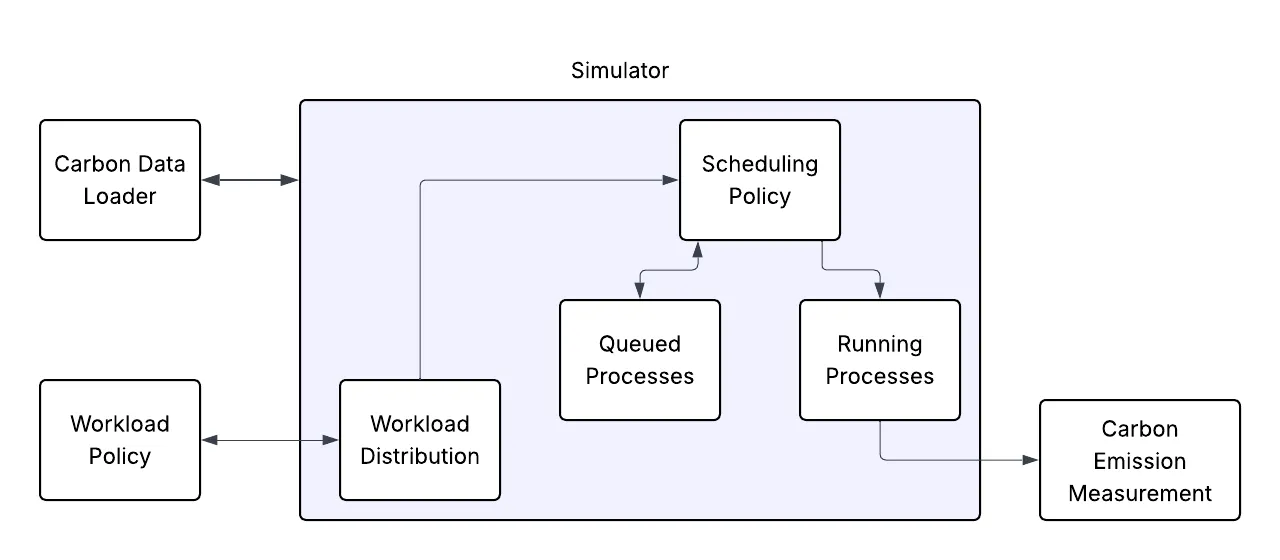
The pipeline is deliberately modular:
- A Carbon Data Loader ingests one year of real grid data (Jan 2024 – Jan 2025) at 5-minute resolution for the CAISO, ERCOT, MISO, and NYISO grids, retrieved through the Singularity API.
- A user-defined Workload Policy produces a Workload Distribution describing when jobs arrive.
- A user-defined Scheduling Policy moves jobs between the Queued and Running states using the workload distribution and carbon-intensity data.
- A Carbon Emission Measurement step scores each completed job and checks for SLO violations.
Schedulers are assumed to have perfect foresight of future emissions, which is a reasonable simplification given that existing statistical models already forecast carbon intensity with high accuracy [4]; a predictive model can be swapped in by modifying the Carbon Data Loader. Workloads are served by three synthetic model classes (small, medium, large) whose inference latency, power draw, and accuracy all rise with model size, standing in for the empirically profiled AI models that remain scarce in public data [5]. Unless noted, every experiment runs 100 times over 1,000,000 jobs on the CAISO grid with a 6-hour SLO timeout.
Results
Grid variability sets the ceiling on savings
Validation against the temporal-shifting results of Carbon Containers [6] reproduces two expected trends: emissions rise as jobs are placed in dirtier grids, and temporal shifting helps far more in grids with volatile renewable supply. Measured as the coefficient of variation (CoV) of carbon intensity, CAISO (CoV = 0.53) and ERCOT (CoV = 0.26) saw temporal-vs-FIFO reductions of 23.51% and 13.48%, while the fossil-heavy MISO (CoV = 0.15) and hydro-heavy NYISO (CoV = 0.14) grids only moved 5.47% and 5.35%. The takeaway is that MoST’s temporal component is a multiplier on however much daily variation a grid already has.
Workload timing determines how much slack exists
Emissions track the shape of the underlying grid curve. On CAISO, morning-spike and afternoon-spike workloads benefited most from a 6-hour timeout (27.34% and 45.42% reductions), because those jobs can be pushed into the late-afternoon solar and wind window [7]. Evening-spike workloads already land in the cleanest part of the day, so they show the lowest absolute emissions but gain little from shifting; there is simply no dirtier baseline to move away from.
Longer SLO timeouts help, with a small violation cost
Increasing the SLO timeout from 30 minutes to 24 hours lowers emissions monotonically, since a longer deadline gives the scheduler more low-carbon windows to choose from. SLO violations fell from 2.23% at the shortest timeout to 0.17% at the longest. Every violation traced back to the gap between a model’s predicted and actual runtime; adding a buffer sized to each model’s runtime standard deviation would likely absorb most of them.
MoST outperforms both static and model-selection baselines
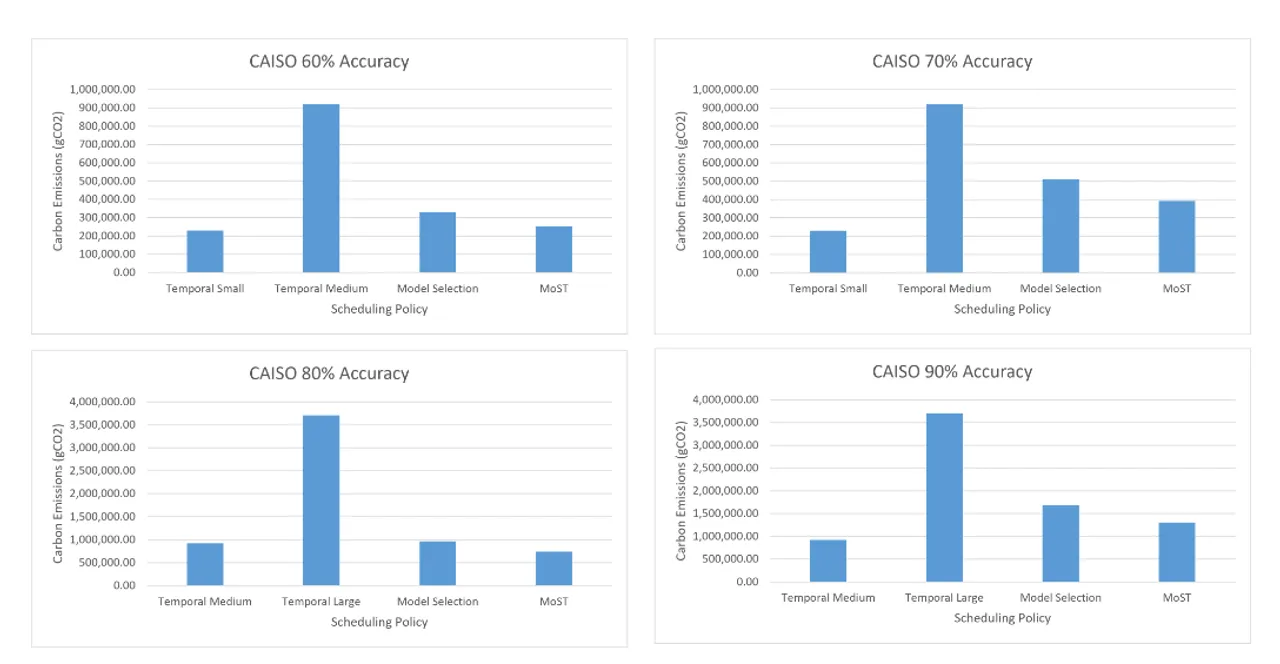
Static “Temporal” policies pin a single model regardless of the accuracy target, so they either miss it (the small model tops out at 50% and fails a 60% target) or overshoot it and waste energy (the medium model delivers 75%). Model Selection fixes the overshoot by always choosing the smallest model that clears the target [8]. MoST keeps that behavior and layers temporal deferral on top, producing the lowest emissions in every configuration tested. As with the other experiments, the size of the win depends on grid variability: against Model Selection alone, MoST cut emissions by 23.23% on CAISO but only 5.41% on the stable MISO grid.
Takeaways
Jointly optimizing which model runs and when it runs is consistently better than either lever alone, and it does so without breaking accuracy or deadline SLOs. The gains are real but bounded: as grids decarbonize, the gap between carbon-aware and carbon-agnostic scheduling shrinks [9], which argues for treating scheduling policies as a near-term complement to, not a substitute for, grid-level investment. Natural extensions include preemptible/fragmented jobs, empirically profiled models in place of synthetic ones, and spatial shifting across multiple datacenters.
- Shehabi, A., et al. (2024). 2024 United States Data Center Energy Usage Report. Lawrence Berkeley National Laboratory. Report Link
- U.S. Energy Information Administration. (2024). Frequently Asked Questions: How much of U.S. carbon dioxide emissions are associated with electricity generation? FAQ Link
- Silva Filho, M. C., Oliveira, R. L., Monteiro, C. C., Inácio, P. R. M., & Freire, M. M. (2017). CloudSim Plus: A Cloud Computing Simulation Framework Pursuing Software Engineering Principles for Improved Modularity, Extensibility and Correctness. IFIP/IEEE International Symposium on Integrated Network Management. Paper Link
- Jin, Y., Sharifi, A., Li, Z., Chen, S., Zeng, S., & Zhao, S. (2024). Carbon Emission Prediction Models: A Review. The Science of the Total Environment, 927, 172319. Paper Link
- Patterson, D., et al. (2021). Carbon Emissions and Large Neural Network Training. arXiv. Paper Link
- Thiede, J., Bashir, N., Irwin, D., & Shenoy, P. (2023). Carbon Containers. SoCC ‘23: Proceedings of the 2023 ACM Symposium on Cloud Computing, 17–31. Paper Link
- U.S. Energy Information Administration. (2024). Solar and Wind Power Curtailments Are Rising in California. Article Link
- Wolfrath, Achanta, & Chandra. (2024). Leveraging Multi-Modal Data for Efficient Edge Inference Serving. 2024 IEEE 24th International Symposium on Cluster, Cloud and Internet Computing (CCGrid), 408–418. Paper Link
- Sukprasert, T., Souza, A., Bashir, N., Irwin, D., & Shenoy, P. (2024). On the Limitations of Carbon-Aware Temporal and Spatial Workload Shifting in the Cloud. EuroSys ‘24: Proceedings of the Nineteenth European Conference on Computer Systems, 924–941. Paper Link