Gopher Grades V2
November 2022 - Present
Github LinkProject Overview
Gopher Grades Version 2 (GGV2) is a grade transparency tool designed for students at the University of Minnesota - Twin Cities. The project is currently used by over 50,000 students and recieves over 5,000,000 page views per semester. The project is ongoing and open to contributions from anyone to encourage student involvement in the development process.
GGV2's frontend is developed using Next.js and Chakra UI while the backend, for which I am the lead, is written in Python, NumPy, Pandas, and SQLAlchemy. In addition to the website, there is a google chrome extension written in pure JavaScript that allows students to view grade distributions directly on the University's Schedule Builder.Background
When I joined the University of Minnesota - Twin Cities as a Computer Science and Data Science major, I was encouraged to use a tool called GopherGrades to ensure that my courseload for future semesters was reasonable. For most of my lower division class this seemed to work fine, however, as I progressed through my major, I found that the data on GopherGrades was often outdated and inaccurate. This was especially true for upper division courses where the data was often mislabeled or outdated. I decided to take matters into my own hands and create a tool that would allow students to view grade distributions for their courses. With my peers in Social Coding, notably Samyok Nepal and Joey McIndoo, we began development.
Backend Development
As the lead data engineer I began by analyzing the 150,000 rows of data from the University of Minnesota spanning the Summer of 2017 to the Spring of 2020. Shown below is a simple schema that I created to store our data in a relational database with SQLite. This design allowed for grades to easily be attributed to professors and courses. One addition that we implemented over the original Gopher Grades application was to attribute courses to departments such that students could choose courses that best fit them within their major or minor.
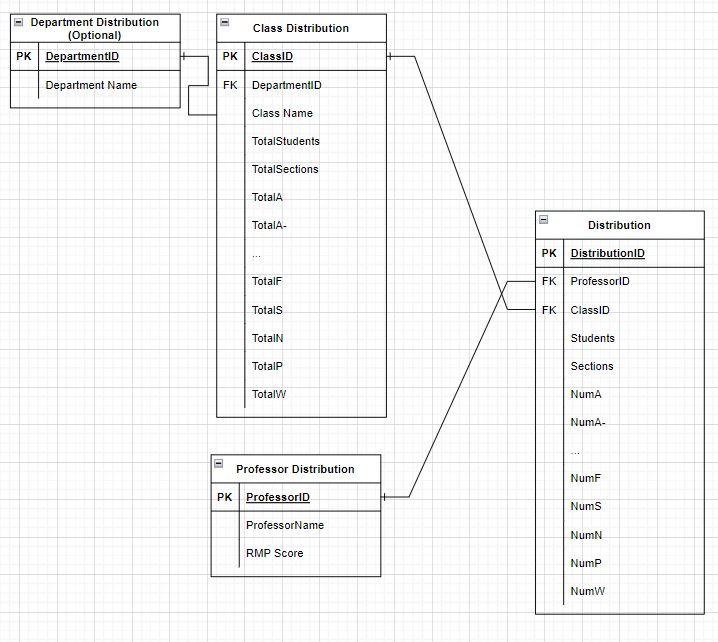
The original schema, simplistic in design and capable of storing the necessary information for easy retrieval.
Prototyping
After the insertion of data into the database, the team and I began prototyping designs to use for the frontend. The design went through many iterations with the first being one generated in bootstrap with a table-esque design but eventually we settled on a more aesthetic frontend that displayed school spirit. Much of this final design was completed on Figma and then transferred to Next.js and Chakra UI.
The original prototype for GGV2, designed in bootstrap.

The final prototype for GGV2, designed in Figma.
Data Validation
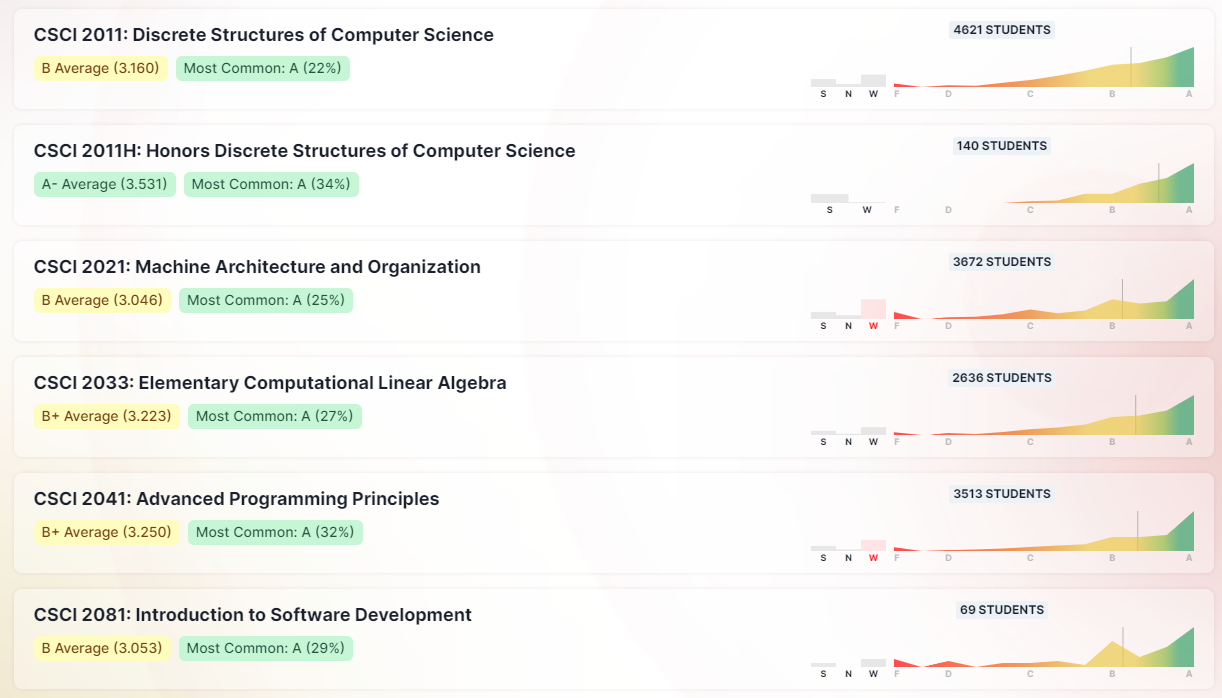
As I shifted through the data it was clear that the original Gopher Grades had inconsistiences with data which was displayed. Firstly, there were cases in which teaching instructors were being mislabeled as professors for a course, a major example being ESCI 1006: Oceanography. Secondly, despite the original Gopher Grades having access to data such as satisfactory, non-satisfactory, and withdrawl grades (S/N/W), they were not being displayed. For this reason, some classes which had very high drop rates were being displayed as having a far better distribution than what was actually true. Lastly, it was apparent that displaying just the mean of a course was not sufficient in providing students with information they needed to make a decision. For this reason, I decided to implement a most-common attribute so that the distribution of a course would not be judged by outliers but by the most common grade.
Grade distributions as displayed on the original Gopher Grades prototype.
Improvements
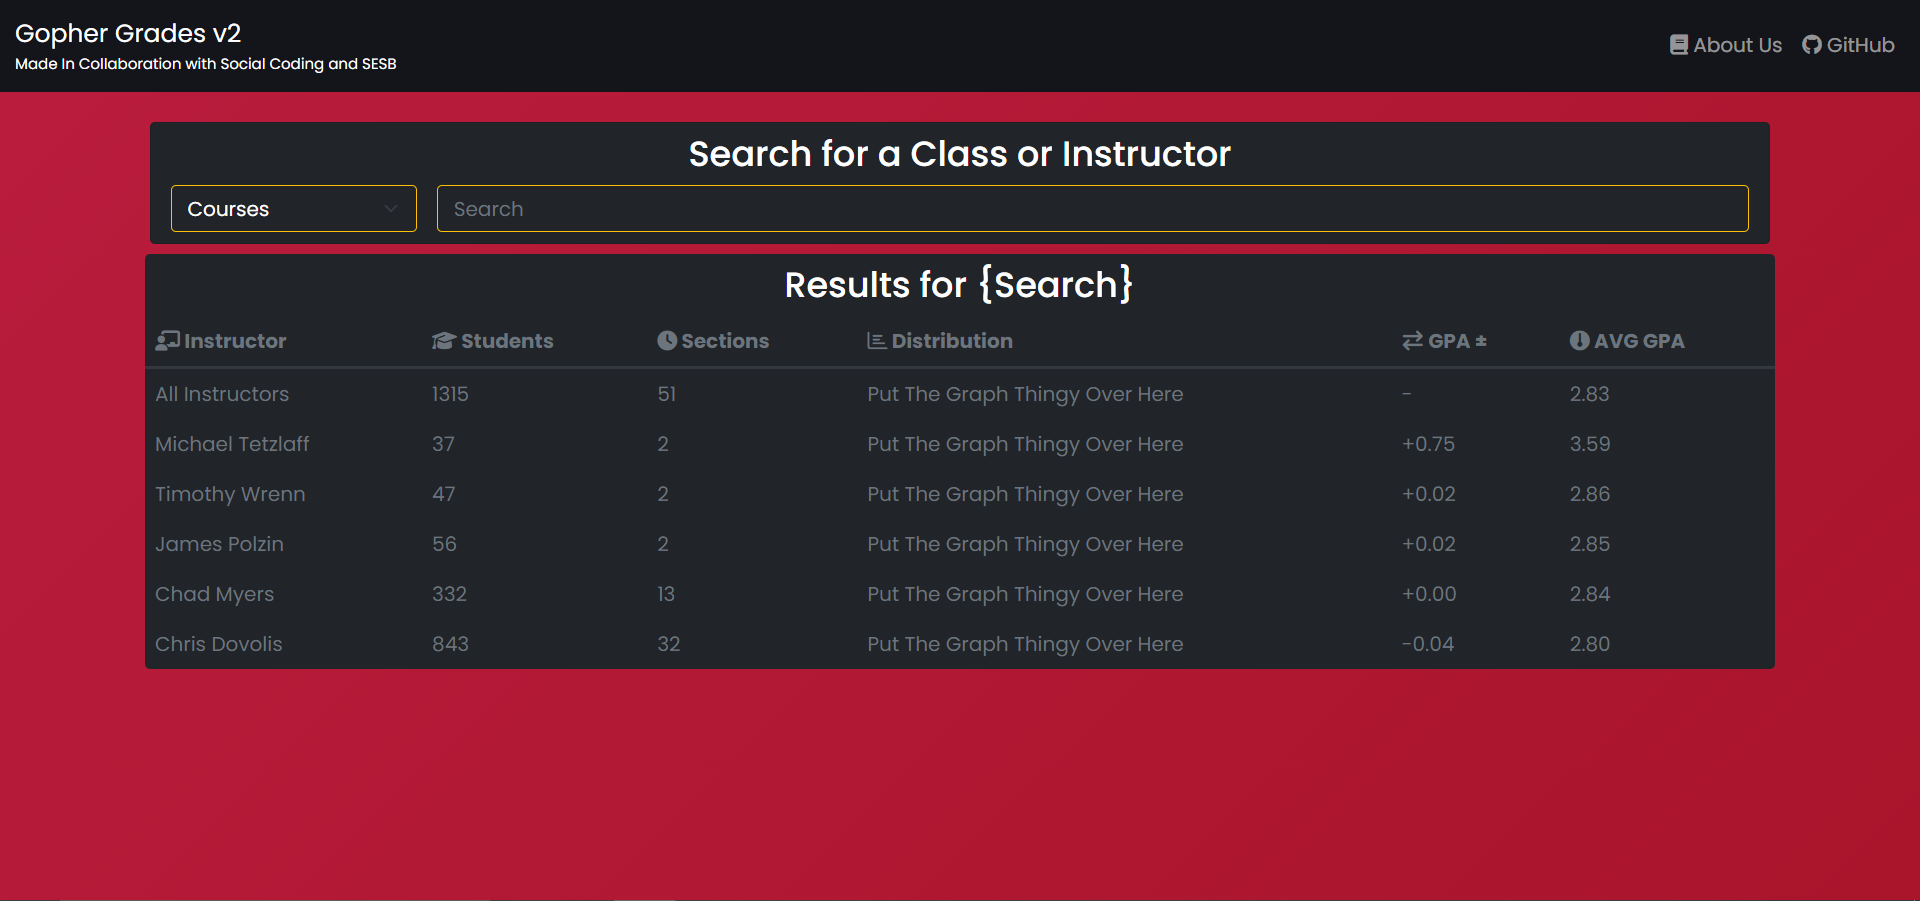
Once the changes in data validation were implemented, my next goal was to introduce additional information that students could use in order to make decisions. Joey and I worked on using data from ClassInfo (Now Coursedog), ASR, and the Student Rating of Teaching. This allowed the introduction of more descriptive course titles, rate my professor scores, liberal education requirements, and course ratings from students provided to the University. On top of this the team and I also developed a chrome extension that allowed students to view grade distributions directly on the University's Schedule Builder.
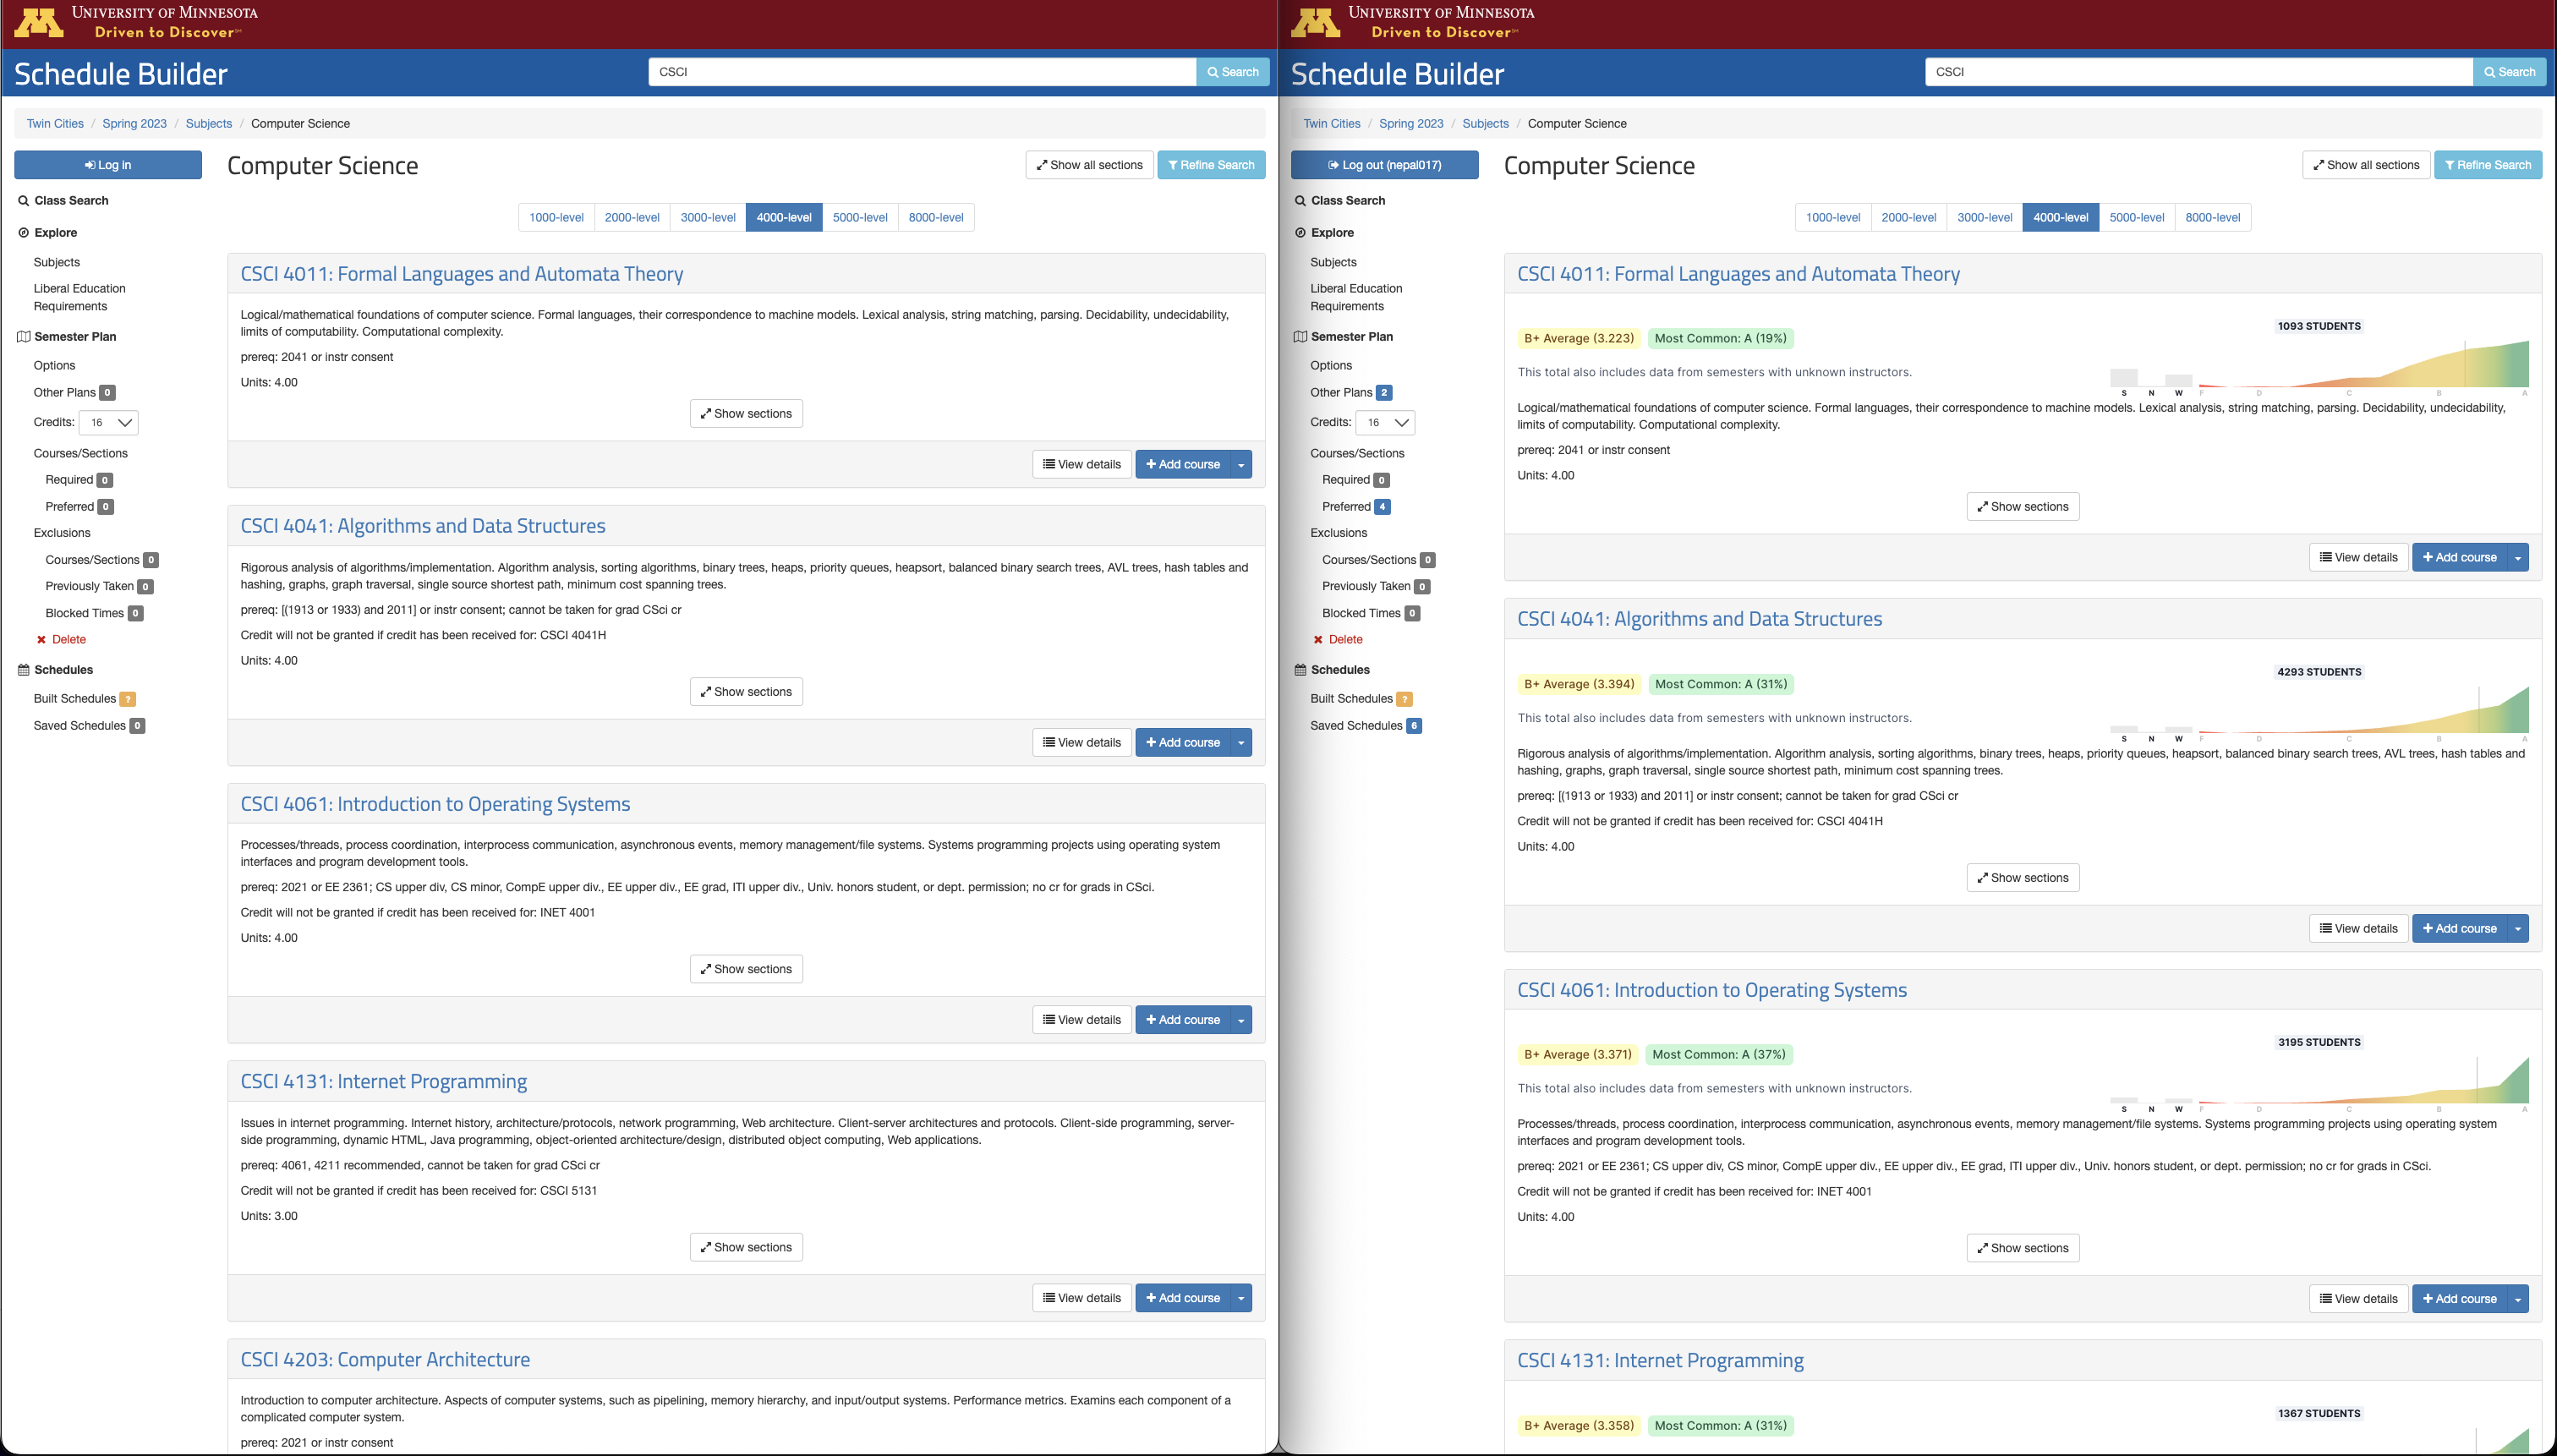
The chrome extension that allows students to view grade distributions directly on the University's Schedule Builder.
Update 2.1
On the conclusion of the Fall 2022 semester, the team greatly expanded to include more developers. Our new focus was to develop tools to improve the user experience. Firstly, we changed the schema to allow students to see grade distributions broken down by term so students could see if grade distributions have changed over time. This also allowed us to include a disclaimer for Covid years so students could see if grade distributions were impacted by the pandemic. In addition, we ported our extension over to firefox so that more students would be able to access our toolkit.
The new schema, capable of storing grade distributions over time.
Update 2.2
As the scope of our backend increased, it was very evident that we needed to improve the speed of our data processing. The nature of our API requests meant that it was taking several hours to fetch information from various sources. This was simply not acceptable. To rectify this I implemented Multiprocessing and Asyncio to see the change of speed in data processing. The results indicated that Multiprocessing was our best solution to reduce our data procesing time from hours to minutes.
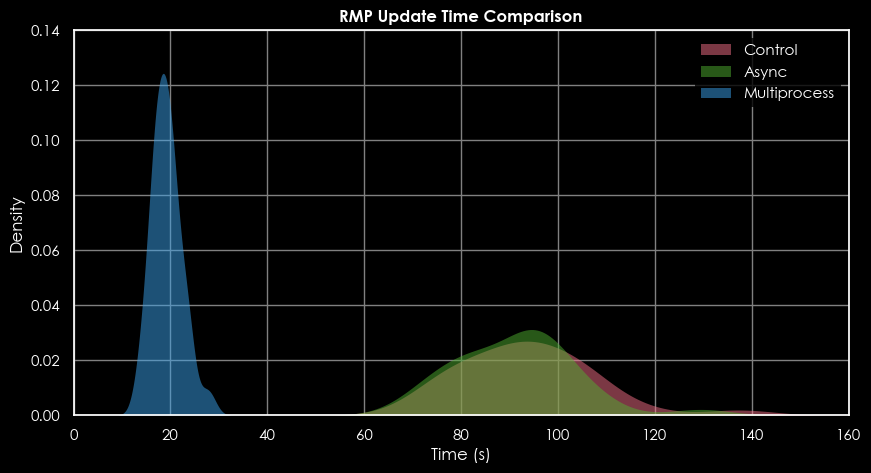
The results of implementing Multiprocessing and Asyncio for Rate My Professor.
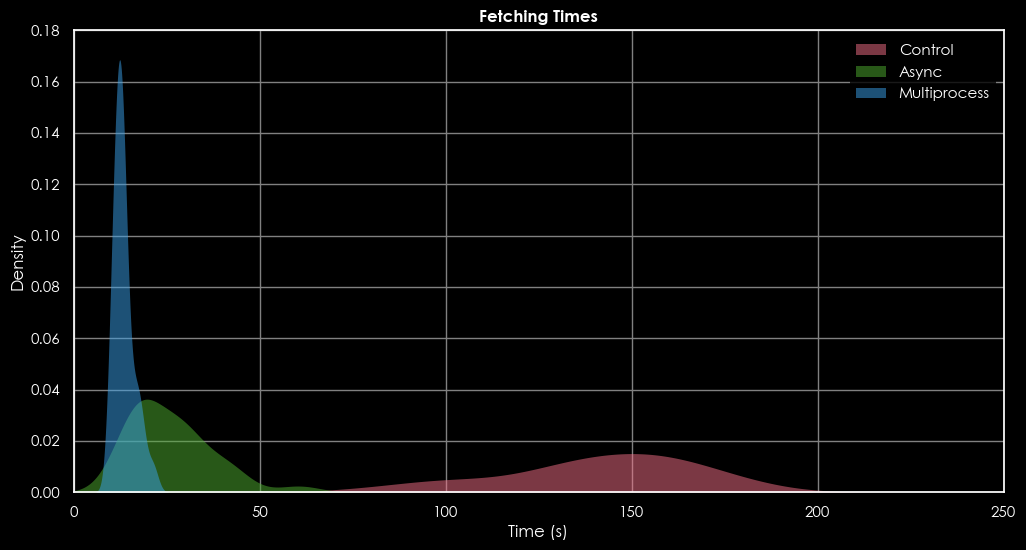
The results of implementing Multiprocessing and Asyncio for general data processing.
Update 2.3
For the Spring 2023 semester many students wanted to implement features that they believed would greatly benefit students: a class map viewer and a schedule to google calendar converter. The class map viewer showcased where a student's courses were distributed across a campus and could even allow them to export the route to Google Maps. The hope for this was that students could see their supposed commute across campus and plan accordingly.

The class map viewer that allows students to see where their courses are located across campus.
The schedule to google calendar converter is a tool that allowed students to access their MyU page and take their courses directly to Google Calendar or export it as an .ics file. Not only did this simplify the process of adding courses to a calendar but it also allowed students to share their schedules with others.
The schedule to google calendar converter that allows students to export their schedule to Google Calendar.
Impact
Overall, I'm very proud of all the work that the team and I have done on Gopher Grades. We've been able to create a tool that has been used by over 50,000 students and has recieved over 5,000,000 page views per semester. The project is ongoing and open to contributions from anyone to encourage student involvement in the development process. I'm excited to see where the project goes in the future and I hope that it continues to be a tool that students can use to make informed decisions about their courses.